Wednesday, December 23, 2009

Late entry by The Times for the 2009 Hot Air Oscars


In July 2009, I nominated two newspapers for the Hot Air Oscar for Most inaccurate numbers in a right-wing newspaper.
A late submission has arrived, nominating The Times for their laughably inaccurate statement about solar power.
The US Energy Department has calculated that a 62-square-mile (160 sq km) parcel of the Mojave [desert]... receives enough sunlight to power the entire country.

Anyone who has seen SEWTHA page236 will know this statement is wrong. The average power of tropical desert sunshine is about 250 W/m2 [see page 46]. Multiply by 62 square miles and you get 40 GW. That is far smaller than US power consumption, which is about 3700 GW (if they mean power in all forms) or 420 GW (if they mean electricity only).
Being more realistic, we should use a power per unit area of 15-20 W/m2, since that's what real solar power stations offer. At that power per unit area, 62 square miles would give you just 2.4-3.2 GW.
What is it about journalists, areas, and squares? One of the ealier nominations for this Hot Air Oscar also featured an incorrectly reported area!

Wednesday, December 16, 2009

Eat bacon and ride a bike!

About 8 months ago, I made a short video with the help of Cambridge University, called "how many lightbulbs" [1]. This week, Cambridge University has published another 6-minute video in the same series - it's fantastic, and it's called Professor Risk. ← click this link to go to the movie in its own page.

Sunday, November 29, 2009

The Energy Game


Some super people have been developing ways of presenting energy numbers and engaging the public and policy-makers in consensus-building conversations.
The next 'Energy Game' will take place at the Science Museum in London at the Dana Centre on 3 Dec 2009 at 7pm-9pm, organized by Serious Change.

Sunday, November 1, 2009

How to boil water - the sequel


One year ago, I wrote a blog titled how to boil water, which linked to a short essay, "how much is inside hot water?". Over the subsequent 12 months, a flood of emailers have requested that I answer their follow-up questions: "does it make any difference if the lid is on the pan?" and "how does a microwave compare with the pan and the kettle?". Dutifully, I did experiments this Sunday, and this link describes the results in full.
The conclusions are that keeping the lid on the pan while boiling water saves about 3%; and that the microwave is a hopelessly bad way to boil water for making pasta.

Sunday, October 18, 2009

Challenged by Carbon


I'm reading Challenged by Carbon: The Oil Industry and Climate Change by Bryan Lovell.
Bryan Lovell is a geologist who has worked in academia and the oil industry for decades. This is an unusual book, intertwining two stories, one of them 55 million years old, and one less than 55 years old. I've not heard either story told before, and both are fascinating.
For the older, slower story, Dr Lovell delves into the details of the geological history of Iceland, the North Atlantic, and the North Sea. He describes how local heavings of the planet's stomach have caused a sub-ocean ridge between Scotland and Iceland to slightly rise and fall, having knock-on effects on ocean circulation and global climate; how slight variations in the average intensity of sunlight in the Northern hemisphere cause changes in climate on a timescale of 20,000 years which can be detected in sedimnetary rocks; and, crucially, how a large natural rapid release of carbon into the atmosphere, 55 million years ago, led to an enormous global warming event, raising the temperature of the water at the bottom of the ocean by more than 4 degrees C within roughly 10,000 years.
The younger, rapidly-moving story is the `insider's view' of how the oil industry, in the last 15 years, changed its mind about human-caused climate change. Starting from positions of climate inactivism (by which I mean "yeah, it may be true, but there's lots of uncertainty and there's no point doing anything, and we oppose greenhouse-gas-reduction treaties") or outright denial, the big oil companies, driven by the science, changed their tunes. First, in 1997, Shell and BP, then, in 2004, ExxonMobil came round to the view "that there is a big problem and that urgent action is required". Lovell knew all the key players well, he was there at the dinner-table discussions where this "Atlantic divide in Big Oil" heaved to and fro, and he hints at the bruising personal conflicts that took place as the oil experts argued about the science. Lovell identifies a particular BP-ExxonMobil debate held by the Geological Society's Petroleum Group in London in 2003 as a turning point in the argument, and describes at length this conversation, whose backdrop was the start of the 2003 Iraq war.
The two stories are connected in multiple quirky ways: the ancient global warming event was probably associated with an uplifting of Scotland that led to the deposition of the North Sea oil fields, from which the oil-folk derived much of their recent wealth; and, more significantly, Lovell describes the 55-million-year-old global warming event as one of the pieces of evidence that helped swing the climate-change argument: oil-men believe what they see in the rocks, and those rocks give uncomfortable evidence for what happens when a large amount of carbon is suddenly released into the atmosphere.
Both stories have the feeling of incompletely-solved detective mysteries. Where did the carbon come from in the ancient global warming event? Was it methane hydrates? Volcanoes? Or some other form of carbon deposit? Was it Iceland that precipitated the global transformation? As for the present-day conversion story, Lovell leaves the reader wondering whether the detective story is yet over - yes, some oil companies greened up their public facades in 2003, but have they reverted to business as usual behind the scenes? And what about the rest of the oil industry?
In the second half of the book, Lovell indicates how he hopes the drama will unfold: "government intervention is essential" in relation to the transition to the low-carbon economy; "concerted action" is required from all oil companies; oil companies should turn their remarkable technical skills to a new waste management business: capturing and storing carbon, especially carbon from coal power stations.
Now, I love physical numbers, so let's recap some of the key numbers for carbon capture. A standard unit of carbon capture and storage is "the Sleipner": thanks to Norway's implementation of a carbon-emission tax of $55 per tonne of CO2 (which can be compared to today's EU market price of 14.10 euros per tonne), StatoilHydro is storing 1 Mt CO2 per year in the Utsira saline aquifer under the North Sea. A 1-GW coal power station, running all the time, produces roughly 7 Mt CO2 per year. So every 1-GW power station would require roughly 7 Sleipners, and the cost to the consumer for electricity from that source might be in the ballpark of an extra 4p per kWh of electricity (similar to the present subsidy for wind power in the UK). The scale of the waste to be stored is worth mentioning. The volume of 7 Mt CO2 (the approximate annual waste from 1 GW coal power station), after it's been compressed to the same density as water, is three times the volume of the great pyramid at Giza. If Britain were to build, say, 33 GW of `clean coal', the volume of compressed waste that would have to be pumped through pipelines and into rocks under the North Sea would be 100 great pyramids per year; or, to put it in personal terms, 13 litres per day per person in the UK, every litre of this waste CO2 having the same weight as a litre of water.
This book is fascinating reading.
David MacKay, 18 October 2009

Saturday, September 19, 2009

Regenerative braking works!


I had a brilliant tour of the Modec electric delivery-vehicle factory in Coventry, and they let me take a one-hour test-drive in an instrumented vehicle (pictured above).
The vehicle had perfectly good acceleration and its response to the pedals has been engineered to make it feel just like a 'normal' vehicle.
For me the most exciting details from the data from this 3.5-ton vehicle were: 1) three headline numbers - maximum power 80 kW; maximum regenerative power 20 kW; typical power at top speed 40 kW; 2) one nicely measured deceleration event from top speed to zero, which allowed an estimate of how efficient the regeneration is at capturing kinetic energy (the answer was that it was better than 50%; and the Modec engineers mentioned a redesign of the transmission that might further improve this efficiency). 3) overall regeneration figures, showing that the regenerative braking recovered roughly 15% of the energy used during the whole test-drive. The graph above shows by the green area the energy recovered, and by the red area the energy that went out from the battery.
Thank you, Modec!
Full story with factory tour images and data

Saturday, August 29, 2009

The carbon-neutral flexible friend - Hot Air Oscar nomination for Barclays

Oh dear... The 'green' twaddle keep on pouring out of the commercial world...
Theo Markettos writes: "I'd like to nominate Barclays for a Hot Air Oscar:
We've launched a new carbon-neutral debit card, which is being rolled out to our debit card users as their current ones expire. ... blah blah ... The Carbon Neutral Company ... blah blah ... reduce carbon emissions in the developing world.
This effectively balances out the harmful emissions of the card's manufacturing process by preventing the release of the same amount of greenhouse gases somewhere else.
"
Theo continues: "Given the huge influences economics and finance can have on behaviour towards climate change, I'm so glad this bank is focusing on the contribution of the small piece of plastic, silicon and epoxy in my pocket."

Yes, indeed - a fine nomination for the Hot Air Oscar for best emulation of bailing the Titanic with a tea-strainer.

The future of energy


The International Herald Tribune and New York Times published an article featuring my energy consumption versus population density diagram.
Here is the article -
Illuminating the Future of Energy
and here are several alternative versions I made of the diagram -

Friday, August 28, 2009

Servants, LEGO, and Kindles

I'm happy to announce that Sustainable Energy - without the hot air is now available for the Kindle. A lot of Kindle users have been asking for this. I hope it works nicely!
Some helpful correspondents sent me some nice links to other people's estimates of the energy output of a human slave. I've added these links to the SEWTHA wiki. If you have additional data or facts relevant to the book, please add them to the wiki. Thanks!
And last but not least, I've been brainstorming with friends about how to make games for understanding energy and for consensus-building. One such game has already been designed using lego to represent energy inputs and outputs.

Saturday, August 1, 2009

A new graph, showing countries' power per unit area


When I gave my energy talk in Cambridge two weeks ago, one member of the audience objected to my figure (page 13) showing per capita emissions by country. It would be fairer, she said, to show the emissions or energy consumption of each country per unit land area. (Guess her nationality... Australian!) I've made a few figures following her suggestion, and I'm displaying my favourite here. This figure shows population density on the horizontal axis and power consumption per person on the vertical axis. The diagonal green lines indicate the power consumption per unit land area, in W/m2. This is precisely the same unit in which I measured or estimated the power per unit area offered by renewables (page 112). Most renewables offer between 0.5 and 5 W/m2.
Conclusion: All countries whose power consumption per unit area is bigger than 0.1 W/m2 are countries who should expect renewable facilities to occupy a significant intrusive fraction of their country, if they ever want to live on their own renewables. Countries with a power consumption per unit area bigger than 1 W/m2 (eg UK, Germany, Japan, Netherlands, Belgium) would have to industrialize most of their countryside, if they want to live on their own renewables. Alternatively, their options are to radically reduce consumption, use nuclear power, and/or to buy renewable power in from other countries.


(Image can be downloaded from here).
PS - I posted another article about this diagram in 2013

Friday, July 31, 2009

Air traffic visualized


There is a very nice you tube video showing all planes flying during a 24 hour period. I have extracted a frame every 5 seconds to make an animated gif which you can view on this page - I find that my animated gif, which goes about 60 times faster than the youtube video, allows you to perceive some things that are hard to perceive in the video.

Wednesday, July 29, 2009

"Diluted" Carbon dioxide is "less harmful" - Hot Air Oscar nomination


Get ready to splutter with astonishment... This Reuters feature about UK Carbon Capture and Storage, featuring the switching on of a new OxyFuel combustion burner contains an astonishing sentence:
The Doosan Babcock burner will not attempt to store CO2 but release it in a diluted, less harmful, form into the atmosphere.
Presumably a Nobel prize is in order, for the discovery that the climate-change impact of CO2 is reduced by diluting it.
I'm not sure to whom this Hot Air Oscar nomination would be directed - to Doosan Babcock? to the journalist? - but anyway, this must be a strong contender for the Hot Air Oscar for most jaw-dropping twaddle about greenhouse gas emissions.

Thanks to Paul for the nomination.

Eco eco eco! And super-efficient too (Hot air oscar nomination)


A Hot Air Oscar nomination for boldest appropriation of the word eco goes to Australian company "todae" for their promotion, in their "eco-lighting" section, of "Super Efficient" Halogen 35W downlights. Their product description explains how awful standard halogen lights are, wasting 80% of the energy as heat. These super-efficient halogen replacements for halogen bulbs will save 30%.
Now, it may seem harsh to nominate an energy-saving product for the Hot Air Oscar when there are so many other "eco" scams out there which save much less energy than this (for example, BMW's "EfficientDynamics" innovations). Well, please keep the nominations rolling in. I notice in Toady's web page (just to the right of Galadriel there) that they are also promoting miniature solar panels. Perhaps more nominations can be harvested right here!

Thanks to Carl Myhill for the nomination.

Monday, July 27, 2009

Wouldn't it be better? No, I don't think so! (Hot Air Oscar nomination)


The website realtimecarbon.org encourages people to be aware of the carbon intensity of the grid, saying "Wouldn't it be better if we could use power when it's greenest?". I am pretty sure that the answer to this question is No!
Imagine, for the sake of simple discussion, that we have a country in which on average half the electricity comes from baseload nuclear power (intensity, 20 g/kWh) and half from demand-following gas (470 g/kWh). And that at night, demand is 60% of the average, and 83% of the electricity comes from nuclear. And that in the day, demand is 140% of the average, and 36% comes from nuclear.
Under these assumptions, the nighttime grid intensity is 95 g/kWh, and the daytime grid intensity is 310 g/kWh.
People using the RealTimeCarbon service will be advised by the red flashing "carbon alert" icon to avoid using electricity during the day, and will be rewarded with feelings of green smugness if they go to great lengths to use electricity at night instead. They may delude themselves into claiming that they have reduced their carbon footprint. You could even imagine them selling carbon offsets based on this sort of electricity-consuming time-travel. But, in the cartoon world that I have just described, the time at which you use electricity makes no difference at all to the carbon emissions! Imagine that 1000 people all earnestly follow the RealTimeCarbon guidance and turn on their 1kW toasters in the middle of the night instead of during the day. What happens? Well, in response to the increase in demand, an extra 1MW of electricity is generated while their toasters are on; and this electricity (in my cartoon world) comes from the gas power stations being turned up just a little bit, whether they turn their toasters on at night or in the day. The true marginal impact of their consumption is 470 g per kWh, whenever they consume.
Now, I am not saying that this cartoon is a faithful representation of what's going on in the UK. Maybe in the UK there are some times of day that are "good" times to use electricity, and others that are "bad". But I think this cartoon proves that "knowing the grid average" doesn't tell you anything useful about that. And I think that the cartoon is a fairly good cartoon of the UK, since in the UK much of the really low-carbon electricity is wind and nuclear, both of which are (at present) not demand-following.
Moreover, I think that if people go to great trouble to check RealTimeCarbon for guidance on "when it is ok to consume", the end result may be a worsening of the UK carbon footprint! Here's two arguments why:
(1) I can imagine people inconveniencing themselves in order to switch on their equipment at night - their inconvenienced lifestyle may well use more energy (for example, when they wait up late for the RealTimeCarbon to go from red to green, they may keep the lights on for longer at night!);
(2) If people think that their electricity is "green" they may give themselves permission to consume more of it. (I know some people argue, for example, that "their electric car is powered by wind, therefore they can drive as much as they want, and it doesn't do any harm to the planet".)
I therefore nominate RealTimeCarbon for a Hot Air Oscar for "Best intentioned but most useless consumer-engagement".

Thanks to Kim West for pointing me to the website and asking questions.

PS - I posted a message on the realtimecarbon forum 3 days ago, querying another aspect of their methodology, and there has been no response.

Table for one


INCPEN, The Industry Council for Packaging and the Environment, have produced a super leaflet called Table for one. It is a detailed document full of numbers estimating the energy footprint of one typical British person's food.
All the numbers are expressed in MJ per week. There's lots of nice diagrams, some showing the breakdown of the energy footprint of, say "Snacks" between food supply, primary packaging, transport packaging, transport from factory, retailing, travel to shops, home storage, and home cooking; and some showing summary numbers.
The one below summarises how much energy the average person gets from all their food (73 MJ/week (2.9 kWh/d)), how much it costs to produce and deliver it (337 MJ/week (13.4 kWh/d)) and how much energy is used to produce the packaging (35 MJ/week (1.4 kWh/d)).

The final figure below shows the breakdown of the footprint by food type, and there is a clear message about meat consumption (as I guessed in my book): meat has a bigger energy footprint than any other foodstuff. [They were assuming that the average person gets 7 MJ per week (1,700 calories per week, or 242 cal per day) of energy from meat; this is a weight of 1029 g per week (147 g per day). For comparison in Ch 13 I assumed a carnivore ate 227 g per day.]

It's nice to see an industry publishing such clear energy-footprint numbers! A copy of "Table for one" (pdf) is sitting on my website. I assume INCPEN don't mind my sharing it there.

Sunday, July 26, 2009

Moon, and Age of Stupid


This post is fairly off-topic for a sustainable-energy blog, as it is a review of a film that I enjoyed, and would like to recommend. Moon is a film about the life of a man, Sam, working for the biggest eco-energy company, mining helium-3 on the moon.
I am happy that all I knew about this film was that "Sam was lonely on the moon". The only review I read was Roger Ebert's, and he (good for him!) didn't spoil the movie by revealing its plot.
I recommend that you read no reviews of the film (apart from Ebert's), and don't even watch trailers for this film. Even looking at the strap-line on a poster for the movie may reveal more about the movie than you really want to know.
To make this post increasingly on-topic, I'd also like to recommend Age of Stupid. I wrote a review of it after seeing its UK premiere, of which I quote the opening paragraph here.
"The Age of Stupid" is a splendid film. Here's what sets it apart. Whereas many documentaries interview each subject briefly, on a single topic, "Stupid" slowly unveils each character and their web of relationships. The principal characters are real people, whose life-stories relate to the topics of climate change, energy policy and consumerism in multiple fascinating ways.
Both are great films, thoughtful, with twists, and thought-provoking.

Saturday, July 25, 2009

Where the wild things are


In SEWTHA, I included, as a joke, a map titled "Where the wild things are". The map shows in white the areas within 2km of human habitation (and thus of course excluded from wind farm development). It shows in black the areas that are more than 2km away from human habitation; these areas are thus tranquil, and also inappropriate places for wind farms. Wind farm development is to be encouraged in all other areas on the map.
Some readers have failed to understand my joke; that amuses me.
What's even funnier is the map produced by the RSPB, "to ease conflict between wind farms and wildlife" (October 2006).
This image shows their map, and the painfully funny thing is how similar its message is to my joke-map's. Almost every good location for wind in Scotland is excluded! - Almost all the islands are given a "sensitivity rating" of "4 high" (the maximum), with the exception of the single island of Jura, which is mainly judged "medium"; most of the highlands are also "high sensitivity". The only really promising locations for wind that squeak through below "medium sensitivity" are the Mull of Kintyre and the southern coast from Glasgow to Stranraer.
How is this map meant to relate to last week's RSPB announcement that the Renewable revolution is overdue?

Wednesday, July 22, 2009

Two exciting things (DII and DWFTTW)


The first thing I got excited about recently is the news announcement that roughly 20 big German companies are talking about investing €400 billion in the Desertec Industrial Initiative. What is thrilling about this announcement is that it involves a sum of money that is in the right ballpark for a genuine plan to get off fossil fuels. So often, government announcements have involved 1 million here, 10 million there, and (rarely) 100 million. I reckon the cost of putting together a new energy system for the UK must be roughly 400 billion pounds, or 10 billion pounds per year from today to 2050. This is much more than millions; but it is still perfectly affordable, given that we already spend 80+ billion per year on energy and 80+ billion per year on insurance. I'd love to see details of what the German companies think they could buy for their 400 billion euro.
The second exciting thing was to discover, thanks to James from Isentropic, what I now consider to be the two best videos on ther internet. Namely: Downwind Faster than the Wind (DWFTTW) [which demonstrates that it is possible to make a wind-powered vehicle that goes directly downwind faster than the wind] and Under the ruler faster than the ruler [which explains with a nice simple model how faster-than-wind travel works].
What intrigues me philosophically about the wind-powered-travel expositions is that it reveals how fragile and weak "understanding" can be: I thought I understood wind-powered travel, and I already knew about wind-powered vessels that can sail directly upwind (eg, Revelation II, pictured). But I got the answer to the question "is DWFTTW possible?" wrong! - even though the principle by which upwind travel works is just the same as the principle of DWFTTW travel. So it seems that when I "understood" upwind travel, what I really did was append to my stack of physics heuristics another heuristic, permitting upwind travel; I didn't add a piece of knowledge that was capable of working in new situations.

Tuesday, July 21, 2009

RouteRANK

RouteRANK provides a journey-costing service, which tells you all the different ways of getting from A to B, how long it will take, how much it will cost, and how many kilograms of CO2 will be emitted. For any A and B in Europe. The image below shows the results for a "Cambridge to Edinburgh" query. Cute! I wish it displayed "energy used" too.

Sunday, July 19, 2009

Most inaccurate numbers in a right-wing newspaper - Hot Air Oscars


Well well! Ed Miliband's announcement of the government's energy road-map has given rise to a remarkable pair of nominations for the Hot Air Oscar for inaccurate numbers in a right-wing newspaper. What's remarkable is that both pieces of poor journalism, in the right-wing press, make assertions about wind power that spin erroneously in favour of wind power!

Nomination 1

The Daily Mail says Research by the University of Southampton has found that a well-placed turbine could make enough energy to power 825,000 homes a year.
Hahahahaha! As usual, the units are wrong. [They should either say "One turbine" could power "X homes" (no "a year"), or "one turbine could make enough energy in a year to power X homes for a year". Why can't people get units right?] But the inaccuracy of "X" is the funniest thing. Realistically, a typical 2MW turbine with a load factor of 27% will produce 0.54MW on average, which, using the standard definition of "a home" (see p 329 for my rant on that topic) means that it can power 1000 "homes", on average. I think a better way to visualize the impact of one such turbine is to say that its output is equal to the total energy footprint (including transport and heating and electricity) of roughly 100 UK people.

Nomination 2

The Daily Telegraph has twice propagated another piece of twaddle concerning the area required for wind farms to provide "all Britain's energy consumption". First there is a letter from Anthony Ridge-Newman, Royal Holloway University of London, published Sept 2008, which says "The most startling thing is that scientists estimate all of Britain's energy can be supplied by an offshore wind area as small as 70 square miles", and that "Britain could be producing enough energy from wind to begin exporting to Europe within 10 years." "Startling" - yes indeed! You'd think you'd be sufficiently startled to check your numbers before writing to a national newspaper! And you'd think the newspaper might check the numbers sent in by its startled correspondents before wasting ink on publishing them. But no. The Torygraph has actually printed this "startling" (and false) meme a second time, this time in an "Analysis" piece authored by "Dave Andrews, head of the Claverton Group", published on 16th July 2009. He writes of onshore wind that "it needs an area of only 70 square miles to generate Britain's total power requirements". Crikey. Did the copy-editor do this to make the Claverton Group look like a bunch of fools? Apparently so, yes! - The Claverton site says the article as submitted said "a 70-mile by 70-mile square". Yes, that would be 70 times more accurate! For the record, (see my survey of UK wind farms if you want, where I show that UK wind farms, whether onshore or offshore, generate roughly 2.5 watts per square metre, on average), 4900 square miles of windfarms would generate about 32 GW on average, which is close to Britain's average electricity consumption (it's about 42 GW). If you want to produce "all Britain's energy consumption today" (ie transport and heating too) then you need about nine times the area, since Britain's primary energy consumption is about 300 GW.
The bottom line - the Daily Mail article is off by a factor of 825, and the Telegraph's rendition of Clavertonism is off by a factor of 70 or 630, depending on whether you allow energy to be confused with electricity. It's a close battle for these awards!
Keep sending in nominations.

Acknowledgements

I thank Christopher Booker for pointing out these two "lunatic" articles. Booker coyly didn't name the two newspapers responsible for propagating the twaddle.

Sunday, July 5, 2009

Sustainable Energy Pirates


I'm upset to discover that some criminal types have gone to considerable lengths to make and sell fake paperback versions of Sustainable Energy - without the hot air on amazon marketplace. [Photo above shows a pirate copy (left) alongside a genuine paperback copy of the book (right).]

This page shows photographs of an example pirate paperback alongside genuine paperbacks. If you bought SEWTHA from amazon marketplace, please check your copy. If it looks awful, maybe it's a pirate copy. (Some reviewers seemed to think that the genuine book looks awful too!) The genuine books look professionally produced and are on good quality paper. To check whether your book is a pirate, please look at the photos. If anyone has been sold one of these fakes, we urge you please to (a) ask amazon for your money back; (b) complain to amazon about the 'marketplace' criminals. Thank you!

Friday, July 3, 2009

Sustainable Energy news


SEWTHA was published in the USA on May 1st. Last week, it was reviewed in Science magazine, and now some people who like SEWTHA have written a submission to slashdot "Solving the Energy Crisis by Tripling Electricity".
If you like this article and have a slashdot account, please click on the "+" button to help the article get promoted.
And finally, the third printing of SEWTHA has just come out, and it has got a NEW COVER (shown above). My publisher and I are very democratic about these things, and when the Guardian's Leo Hickman opened his review with the words "It has a crashingly dull cover and title", we were happy to respond to feedback. We hope you like the new cover! [full size image]
The third printing brings the number of copies printed to 30,000.

Sunday, June 28, 2009

Visualizing wind farms for Cambridge University


I thought it would be a fun exercise to see, on a map, whether we could imagine powering the University of Cambridge from local wind turbines. The University's average electricity consumption is 11.4 MW, and its gas and oil consumption is 8.7 MW. (That's the University departments and offices only, not the colleges.) If we switched our heating over to heat pumps and insulated all the buildings, maybe the total consumption could be covered by 16 MW of electricity. Probably about 72 MW of wind capacity would be required to produce 16 MW on average. That's about 36 big wind turbines of the standard 2-MW size in the photo above, which shows Red Tile wind farm.
This web page contains my notes and the map, which is reproduced below. [Please click on the map to see the whole thing.]

The left side of the map shows West Cambridge, with locations for wind turbines shown by the green and red circles. Exclusion zones are indicated by blue circles. I've assumed that turbines could be put alongside the motorway and that motorway noise would dwarf the turbine noise, so that smaller exclusion zones are appropriate near motorways.
The right hand side of the map shows the Red Tile wind farm to the same scale.
I don't know who owns any of this land, nor have I done any wind surveys, so no-one should take this map seriously.
It would cost roughly £70 million to put up these turbines.
If people don't like the idea of having iconic wind turbines ruining the tranquility of the M11, another option would be for the University to buy a 1.6% share of a new nuclear power station. That might cost £32 million or so.

Wednesday, June 17, 2009

The one-percent rule, leading to patriotic thoughts about the Falklands


I wrote an article for the Guardian. I called it "The one-percent rule". They called it "Talk of 'kinetic energy plates' is a total waste of energy".

Here's the article I wrote.

I'd like to suggest a one-percent rule for news-articles about energy-saving gadgets or renewable energy systems. The rule says "a gizmo may be discussed only if it could lead to energy savings of at least 1%". I suggest this rule not because minnow-sized savings are
worthless, but because the public conversation about energy surely deserves to be focussed on bigger fish.

The latest piece of green twaddle that's wasting people's attention is
the story (15 June 09) about a new supermarket carpark that has "kinetic road plates" creating "green energy" from the motion of customers' cars.

I'm not saying that these systems don't actually work; perhaps they do save a little bit of energy that would otherwise be wasted in the brakes of the cars arriving in the carpark. But my suggestion is that these systems save so little energy, we shouldn't waste newspaper space on such stories. There must be more important things to discuss (assuming we are serious about getting off fossil fuels).

To prove my point, let's compare the energy that might be saved by the "kinetic road plates" with the total energy used by a typical trip to the supermarket. Let's guess that the kinetic road plates extract one fifth of the kinetic energy of the arriving car. For a car
weighing one ton travelling at 20 miles per hour when it hits the road plates, the extracted energy comes to 0.002 kilowatt-hours (kWh). Now, the energy used by the car, assuming it is driven 3 miles to and 3 miles from the supermarket with a fuel efficiency of 33 miles per
gallon, is about 8 kWh. The savings from parking at the green carpark thus amount to one four-thousandth of the energy used by the trip to the supermarket.

That's much less than one percent. So this "green energy system" is just eco-bling, creating a delusion of happy progress while distracting people from serious change.

What are some ideas that satisfy the one-percent rule? Well, there's lots of examples: a domestic solar hot-water panel will generate roughly 4 kWh per day of hot water, which is roughly 50% of a typical family's hot water consumption, and a bit more than 1% of their total
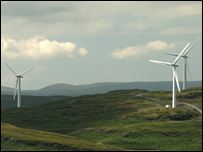
energy footprint. Example two: wind power - a ten-fold increase in Britain's wind turbines would produce on average 4 kWh per day per person, which is about 4% of our total energy footprint.

So solar panels and wind turbines deserve to be on the public's radar. Of course, solar panels and wind turbines are old news. So let me close by suggesting a new topic of conversation that also satisfies the one-percent rule.

When we are planning wind-farms, it makes sense to put them up first in the windiest spots, where the hardware will give the biggest return. So let's talk about wind-farms in the Falklands.

Mean wind speeds in the British overseas territory of the Falkland Islands are 9-11 metres per second, compared with 6-9 metres per second around the British Isles. 1250 3-megawatt turbines in the Falklands would probably produce an average power of 2.5 GW (or 1 kWh per day for every one of the Queen's 60 million subjects). That's roughly 1% of the total energy footprint of the United Kingdom.

Are there any problems with this idea? Well, first, as usual, the wind farms "would spoil the view". There's no free lunch. Serious renewable power requires industrial facilities in the countryside; the point of proposing wind-farms in the Falklands is to reduce the area of countryside "spoiled". The total area of the Falklands is a bit more than half of Wales; the area occupied by 1250 windmills would be about one twelfth of the Falklands. Sheep could, of course, still safely graze among the turbines.

Second, the average power produced by these windmills would probably exceed the electricity demand of the three thousand inhabitants of the Falklands, so we'd need to find other ways of using the power. A traditional way of handling the problem of excess electricity is to
produce aluminium. Iceland and Norway, for example, produce 1% and 4% of the world's aluminium respectively. The Falklands wind-farm sketched above could produce 1.5 million tons of aluminium per year - 5% of world aluminium production. Aluminium is just one example of
a storable product; the electricity could be used to make other energy-intensive materials such as magnesium and cement.

Notes
Mean wind speeds are given at a height of 50m.
Source: http://www.gaisma.com/en/location/port-stanley.html
http://www.gaisma.com/en/location/grytviken.html
I assumed the load factor of turbines in the Falklands would be 66%.

Addendum, in response to the flood of comments on the Grauniad site
Thanks for the feedback! (1) To the Falkland-wind-critics who point out that Aluminium production needs steady power... Yes, I'm aware of that; I thought of saying so in the article, but decided brevity was a virtue. What I would have added is "to smooth out the wind fluctuations, we could create pumped storage systems, or other energy storage systems, just like the four pumped storage systems in the UK (which were built mainly to help match inflexible nuclear supply to fluctuating demand). This would bump up the cost a little.
(2) As for the energy-cost of shipping materials to and from the Falklands, this is one of the striking things I learned when writing Sustainable Energy - without the hot air: those monster ships are amazingly efficient at transporting stuff - far more efficient than trucks. (Read about it on page 91.) I'm not saying that Falkland-wind is definitely a good plan - just that you need to check the numbers before knocking a plan simply for using international shipping.
(3) And finally, to the people who insist in enjoying the delusion that the power harnassed by these silly ramps would be significant if only I compared it with the power consumed by the supermarket instead of with the power consumed by the trip to the supermarket: no. Work out the numbers! Here is a rough stab at the calculation: As you can read on page 93, UK supermarkets consume 0.5 kWh per day per person. If every person visits their favourite supermarket once per 7 days, then their supermarket is consuming 3.5 kWh per personal visit. If the silly ramps manage (as estimated above) to provide 0.002 kWh per arriving car, then the silly ramps are covering less than one thousandth of the energy consumption of the supermarket. Cut the twaddle. These things are eco-bling, whichever way you look at them. All you need, to see this, are simple numbers. [The Falklands idea may turn out to be a bad idea too, but I hope people find it fun to think about.] David MacKay, Cambridge.

How much can one drinks bottle achieve?


I'd like to nominate the belu bottle of natural mineral water for the Hot Air Oscar for the greatest ecological achievements by a 500-ml beverage container.
It's an incredibly long list, spanning the whole ecosystem. On the front of the bottle there are icebergs and a penguin. On the back, a field full of flowers and butterflies.

The bottle's achievements, in more detail:
  1. It's the UK's first compostable bottle.
  2. They can be composted back to soil in only 8 weeks - a million times faster than plastic bottles!!

  3. Every bottle you buy provides clean water for one person for one month
  4. It's the first bottled water that does not contribute to global warming
  5. It is penguin approved
  6. All profits go to clean water projects

Surely it is an honour simply to stand in the presence of such a vessel.

Monday, June 8, 2009

Hot Air Oscars nomination: Easy Being Green


A nomination for most inspirational fluff on a bottle goes to Avra, Greek water manufacturers.
"It's so easy being green" ...on a plastic water bottle, in a country where the tap water is perfectly drinkable.
[From flickr, thanks to jinty for the nomination.]

Friday, May 22, 2009

Corrections and clarifications (Wind, Whitelee, Wales...)


Perhaps I need to stop doing media interviews...
I wrote some notes about Whitelee recently. Last weekend, the BBC asked me to record some comments in advance of the official Whitelee switch-on. My comments focussed on the scale of renewables required to really make a substantial contribution to British energy consumption. Unfortunately my comments may have been misinterpreted - partly because I wasn't actually sure what I was being asked! The interview was recorded by a nice subcontracted interviewer who had been fed the 3 questions to ask me. The first question was "are the government's targets achievable?" ... with no indication of what targets the question referred to. The child poverty targets? "No more boom and bust"?
I answered the question assuming we were discussing long term climate targets. In one take I referred to "the government target of a complete decarbonisation of our electricity supply system by 2030." This was an error, as the government hasn't adopted that target (yet); it is the Committee on Climate Change that has indicated that they think almost-complete decarbonization of electricity by 2030 is essential.
As I have discussed in this article, if the UK is to get off fossil fuels, we need to be talking about big efficiency measures, probably lots of electrification of transport and heating, and big growth of 'green' electricity sources - for example, something along the lines of windfarms with size similar to the area of Wales, and a five-fold increase in nuclear power. Each of these two sources would deliver roughly 20 kWh per day per person.
Do I think Whitelee is a figleaf? Not at all. It's awesome, and it does generate real power, on average - enough to power hundreds of thousands of electric vehicles, for example - though not quite enough to "power Glasgow".

Sunday, May 17, 2009

Wind farm power-per-unit-area data complete


I have updated my data on windfarms.
I've gone through roughly 75 farms, finding the power per unit area. You can see the results here.
The conclusion is that many Scottish wind farms, located on hilltops, have powers per unit area of about 4 W/m2. English and Welsh wind farms are in the range 2-3 W/m2 for the most part, though there are a few in England below 2 W/m2.
Incidentally, while looking at the windfarms, I had a think about the Braes of Doune photo above, which shows a windfarm ruining the view of Stirling castle. The distance from Stirling Castle to the wind farm is actually about 15km. The photograph subtends an angle of about 3 degrees. It is the sort of view you get through a 670-mm zoom lens.
The two summary figures from my wind farm survey are shown below. The top one shows power per unit area versus turbine diameter; the lower one shows it versus wind farm size. The point style indicates the type of windfarm location.


Acknowledgments
Thanks to Oswald Consultancy and the Renewable Energy Foundation for collating most of the power generation data and turbine specifications. All the original data can be found at OFGEM. Thanks to Ordnance Survey for their getamap service.

Saturday, May 16, 2009

"Better than BS 7671 : 2008 IEE Wiring Regulations 17th Edition!"

Friends have been asking "how is the book selling?" - I'm happy to report that Sustainable Energy - without the hot air has been doing quite well. On amazon.co.uk, its sales rank among all books has been wandering around the 100 mark for some time now. And in the list of the most popular Science and Nature books, it's at number 4, ahead of Dawkins' God Delusion, and (a great personal triumph, this) ahead of the IEE's renowned "On-site Guide; BS 7671 : 2008 IEE Wiring Regulations 17th Edition".


I made a graph showing how the sales rank of SEWTHA has evolved on amazon.co.uk and on amazon.com. The light vertical lines mark events, with the most significant ones being the Economist's review, the Cory Doctorow review, and the coverage by the Guardian, which took the sales rank to 47.

The latest piece of good news is that I've been elected a Fellow of the Royal Society. The Society's press release mentions me and the book, which is very nice of them!

Oh no! Green electricity spat!


As I mentioned in another post, I switched from electricity-generator, Powergen, to "Good Energy", out of irritation at Powergen's perpetual greenwash.
Now I've learned from The Guardian that Good Energy may have been duping me with greenwash too!
One of the minor advantages of Good Energy over the competition was that they claimed to actually retire some ROCs (renewable obligation certificates), which has a genuine "additional" effect, as it increases (slightly) the financial incentive to people putting up renewable generation facilities.
However, according to the Guardian, Good Energy have not been retiring as many ROCs as their blurb led customers like me to believe. Oh dear.
Their blurb said things like:
"Good Energy goes above and beyond the percentage required by the government (8.9 per cent in 2008), by retiring an extra five per cent of ROCs (ie, 13.9 per cent in 2008)."
but in fact, they've been retiring only about two per cent.
It's an awkward consequence of the slightly goofy Renewables Obligation system.
To get your subsidy for generating wind power, you have to cash in the certificates. (The certificates are then bought by brown companies like Powergen that are not generating enough renewables, to get them off the hook.) If you retire the certificates instead then you don't get any subsidy. So it's really hard to do anything "additional". People trying to do Good get no subsidy.
If Britain had a feed-in tariff instead, like Germany, I think this Catch-22 would be removed. Everyone who generated extra renewable electricity would be rewarded for doing so, and no-one else would be let off any hook thanks to their generation.
It's sad that Good Energy and Ecotricity are having this spat with each other. I was at a round table meeting in London, organized by the Ecologist magazine, attended by both the CEOs of both companies, and there, everyone seemed to be on the same side.
I think, going by the news article, that Good Energy have been naughty. And as a customer I feel a bit disappointed. My advice to Good Energy would be "stop trying to make out, through funny accounting, that you have been retiring 5%. Just give up on the retiring idea".

Whitelee powers Glasgow again


Whitelee wind farm, the biggest wind farm in Europe, is to be completed and 'switched on' this week. And
the news says that the power company is applying to extend the wind farm to increase its capacity from 322 MW to 614 MW.
I mentioned the predicted output of Whitelee in my book (page 33). Since the predictions for Whitelee were one of the sources for my estimated wind-farm-power-per-unit-area of 2 watts per square metre, I thought it was a good idea to look at Whitelee's updated numbers.
When I was writing my book in October 2006, Whitelee's predicted output was said to be "enough to power Glasgow" (Independent, Oct 10, 2006). And now, the latest news says
that, with the proposed increase in capacity from 322 MW to 614 MW, the farm will... generate enough power for [all the homes in] Glasgow
!
Curious, Alice might say. We run, and we stay in the same place?
Here are the new numbers.
With two extensions, the total number of turbines would be 221, the capacity would be 614 MW, and the predicted total output is "340,000 households", which in sensible units is 184 MW (assuming that "a household" is defined to be 0.54 kW). This implies a load factor of 30%. The area of the site (according to the Sunday Herald) will increase to 75 km2. So the average power per unit area of the enlarged wind farm is predicted to be 2.45 W/m2.
What is the honest relationship of Whitelee to Glasgow? (I think talking about 'households' is a bit misleading.) The predicted output of Whitelee, shared between the 616,000 people of Glasgow, would deliver 7 kWh per day per person on average. That's roughly 40% of the total electricity consumption of Glasgow, and roughly 6% of the total power consumption of Glasgow (that's 'total power' including transport, heating, etc; not just electricity).

Implications for the scale of wind farms required for a substantial contribution to British power consumption


If we assume Whitelee (including its planned extension) is representative of future big wind farms that could be built in Britain, here are some more numbers.
  • The government's 2020 target is for "33 GW" of wind capacity. That would require 54 more Whitelees. The area of those wind farms would be about 4000 km2, about 20% of the area of Wales. The power delivered by those wind farms would be about 4 kWh per day per person, which is roughly 4% of the UK total power consumption today. (That's 'total power' including transport, heating, etc; not just electricity).
  • If we wanted to get 20 kWh per day per person from wind power, we'd need 270 Whitelees, which would take up an area of 20,000 km2. That's roughly the area of Wales, or 8% of the area of the UK.

If we want to get off fossil fuels using renewables, we must expect those renewable facilities to be somewhat intrusive.

End notes (in anticipation of the responses people often make)

  1. Yes, the wind-farm land in between the wind turbines can also be used for agriculture or other activities.
  2. Yes, the output of wind farms fluctuates, so if we build wind farms we will have to do some other smart stuff, as discussed in chapter 26 of my book. For example, ensure that lots of smart [easily switch-off-and-on-able] demand is added to the grid, for example, charging electric vehicles and running heat pumps to make hot air and hot water.


Friday, May 8, 2009

Hot Air Oscars nomination: GO-GREEN


We are happy to nominate for the "best GREEN advertising" Hot Air Oscar, the "Eco-Smart" organization in America who advertise "877-47-Go-GREEN" on the side of their tastefully green HUMMER.

Is David MacKay "trying to make wind sound useless"? Let's look at more data


I'm delighted to see that the response to Sustainable Energy - without the hot air so far has been remarkably positive. There's just one or two folks who have become convinced that I am anti-wind, that I am deceitfully making wind sound worse than it really is; and they have been running round leaving comments on blogs (for example, you can find one lurking in the comments on this excellent article about the financial cost of wind power (the oil drum), who asserts "MacKay has made a serious error in his calculations of on-shore wind energy resources. ... Some of the wind farms initially built were in poorer locations but close to electric transmission lines, so his calculations are not good examples of what is possible in UK.")
I've written three blog posts about this topic already, encouraging people to provide real data rather than just spreading poisonous rumours. I've now worked through the ordnance survey maps and ROC register entries for about 15 windfarms around the UK, and included the data and maps in a presentation I made at a wind energy conference in St Andrews this week. I am still working on this; what I have focussed on so far is mainly the newest windfarms for which data is available, with the largest numbers of turbines, with biggest diameters, and mainly on scottish hilltops or welsh hilltops or near to the coast. The new data starts at slide 30 and is summarised on slide 41. These onshore wind farms have powers per unit area between 2 and 4.6 watts per square metre. To indicate the rough scale of windfarms required to deliver large amounts of power, I assumed in the book a power per unit area of 2 watts per square metre. So yes, there are windfarms that have powers bigger than 2 watts per square metre. Was I deliberately "making wind power seem worse than it is"? No. I chose 2 watts per sq metre as an estimate of what we could get if we put up lots of wind farms (with the area of Wales), which is obviously going to be less than the power per unit area of the very best spots. Yes, I willingly agree that if we want wind to make only a small contribution (for example, less than 1 kWh per day per person), then it would be appropriate to assume a higher power per unit area - perhaps 3 or 3.5 W/m2 instead of 2 W/m2, if we keep building in the best spots.

As evidence that I am not deliberately biased against wind, take a look at the data for offshore wind farms.

In my book I assumed a power per unit area of roughly 3 watts per square metre for offshore wind. But the two offshore windfarms in my data have powers per unit area below 2.5 watts per square metre.
There are several other scientists who have used a power per unit area similar to mine when estimating wind resources. For example, Socolow from Princeton uses 2 watts per square metre when discussing his "wedges". On page 234 of my book I cite a study by Elliott et al. (1991) in which windfarms in the best locations in America, covering an area equal to that of California, were estimated to have an average power density of 1.2 W/m2.
While my book is technology-neutral, the truth is that personally I am pro-wind! I think wind farms are brilliant, and I'd be very happy be within eye-shot of one almost anywhere in the ordinary countryside.
Please could the commentors call off the dogs?
Thanks! David

More or Less - the Director's Cut

I was on "More or Less"a couple of weeks ago, and wrote an article for the BBC. One topic mentioned was how much good it does to unplug phone-chargers when they are not in use.

On today's programme (8 May 2009) they are going to read out an indignant listener's letter pointing out that "if everyone unplugs their phone chargers, it adds up to a HUGE saving". More or Less asked me to write a short response, which is going out today. I'm worried that people will get the impression I am against switching anything off. So for the record, I would like to point anyone who's interested to the relevant pages of my book (p114) and Chapter 22 (p155) which should make clear that I do think that it's a good idea to find the big vampires and switch them off!
Here's what I wrote for today's More or Less, in full:
Yes, if sixty million people all make a figleaf gesture that saves half a watt (which is roughly one ten thousandth of their power consumption), then the total power saved is,
sixty million times half a watt
which is 30 megawatts, which sounds like quite a lot. It's one thirtieth of the output of a modern power station, for example. But this "if-everyone" multiplying machine is just a misleading way of making something tiny sound big:
30 megawatts is still just one ten thousandth of Britain's total power consumption.
Multiplying tiny things by sixty million to make them sound big is BAD because it distracts people from thinking about sixty million bigger things that are more deserving of our attention. [Heating sixty million buildings, and driving sixty million cars, for example.]